Matlab灰度图像处理 灰度图像二值化: 1 2 3 4 5 6 7 8 9 10 11 12 13 14 15 16 17 18 19 20 21 22 clear; clc; f=imread('rice.png' ); imhist(f); title('直方图' ); [m n]=size (f); T=128 ; for x=1 :m for y=1 :n if (f(x,y)<=T) g(x,y)=0 ; else g(x,y)=1 ; end end end figure ;subplot(1 ,2 ,1 ),imshow(f); title('原图' ) subplot(1 ,2 ,2 ),imshow(g); title('阀值为128' );
非线性灰度变化 对数变化:
低灰度扩展高灰度压缩,适合处理过亮的图像;
1 2 3 4 5 6 7 8 9 10 11 clear; clc; s=imread('Fig0309(a)(fractured_spine).tif' ); r=47 ; c=double(s); d2=r*log (1 +c); i2=uint8(d2); subplot(2 ,1 ,1 ),imshow(s); title('原图' ); subplot(2 ,1 ,2 ),imshow(i2); title('对数变化' );
指数变换:
1 2 3 4 5 6 7 8 9 10 11 12 13 14 clear; clc; i =imread('Fig0308(a)(fractured_spine).tif' );r=double(i ); r1=1.1 ; c=1 ; s=c*realpow (r,r1); i2=uint8(s); subplot(2 ,1 ,1 ); imshow(i ); title('原图' ); subplot(2 ,1 ,2 ); imshow(i2); title('指数变化' );
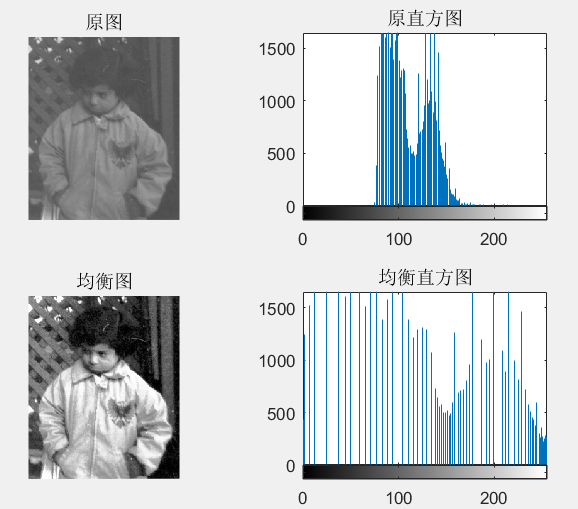
直方图均匀化 使灰度分布更为均匀,减少对比度:
(动态扩展范围)(INT:取整)
1 2 3 4 5 6 7 8 9 10 11 12 13 14 15 16 17 18 19 20 21 22 23 24 25 26 27 28 29 30 clc; clear; img=imread('pout.tif' ); N=imhist(img); subplot(2 ,2 ,1 ),imshow(img); title('原图' ); subplot(2 ,2 ,2 ),imhist(img); title('原直方图' ); for i =1 :size (N) P(i )=N(i )/sum(N); if i ==1 S(1 )=P(1 ) else S(i )=S(i -1 )+P(i ); end end r=round ((255 ).*S+0.5 ); img1=img; for i =1 :size (img1(:)) value=img1(i ); if value==0 img1(i )=1 ; else img1(i )=r(value); end end subplot(2 ,2 ,3 ),imshow(img1); title('均衡图' ); subplot(2 ,2 ,4 ),imhist(img1); title('均衡直方图' );
直方图标准化 直方图标准化指的是用衣服标准图像来对现有图像进行约束限定变化,使它的直方图符合规定新图形的直方图。需要用到histeq函数,histeq函数不仅可以用于直方图标准化,还可以用于均衡化,均衡化的用法是histeq(‘需要均衡化的图像’);
1 2 3 4 5 6 7 8 9 10 11 12 13 clear; clc; I1=imread('pout.tif' ); I2=imread('cameraman.tif' ); [hgram,x]=imhist(I1); J=histeq(I2,hgram); subplot(1 ,3 ,1 ),imshow(I1); subplot(1 ,3 ,2 ),imshow(I2); subplot(1 ,3 ,3 ),imshow(J); figure subplot(1 ,3 ,1 ),imhist(I1); subplot(1 ,3 ,2 ),imhist(I2); subplot(1 ,3 ,3 ),imhist(J);
截图:


